
PatentSight+
Make High-Value Strategic Decisions with LexisNexis® PatentSight+
Providing the world’s leading innovators with contextualized and evidence-based IP insights and analytics.
PatentSight+ enables core IP activities such as competitive intelligence and benchmarking, portfolio optimization and more, by bringing together highly curated and enriched datasets, cutting-edge analysis tools with streamlined workflows and powerful visualization capabilities, all within a single platform.
Data Quality
& Coverage
To address the challenges with patent data quality, including incomplete owner information and ambiguous legal status.
Get more accurate insights by incorporating multiple data types that have been rigorously cleansed, quality checked and enriched.
Actionable
Insights
To more efficiently navigate the complexities of IP and move beyond tactical management of patent portfolios.
Increase depth and speed to insights through powerful AI-driven analytical capabilities and proprietary metrics.
Impactful Visualizations & Communication Tools
To eliminate the perception of IP as a cost center and better communicate its value to the business.
Optimize workflows, boost efficiency, and elevate IP awareness and storytelling through powerful visualization tools.
PatentSight+ Solutions
In today’s rapidly evolving landscape, IP professionals face the daunting challenge of navigating a complex maze of intellectual property on top of increasing cost pressures. These challenges demand clear, actionable insights to make strategic decisions with confidence.
Competitive intelligence & benchmarking
Stay ahead of the competition and disruptive technologies.
- Monitor and analyze competitors’ R&D strategies as well as competitive and technological landscapes.
- Identify emerging competitors and new entrants early.
- Provide proactive recommendations for strategy to top management.
Portfolio management & optimization
Determine your patent portfolio’s competitive strengths and weaknesses to better understand what strategies or actions are necessary to stay ahead of competition.
- Increase portfolio efficiencies.
- Define country filing strategies.
- Manage annuity costs.
- Uncover pruning potential and cost-saving opportunities.
Disruptive technology scouting
Spot upcoming competitors and disruptive innovations early on. Stay up to date on current technology trends and explore the patent landscape in any way you find insightful.
- Identify disruptive technologies.
- Reveal R&D trends.
- Explore complementary technologies.
R&D and innovation
Improve your innovation performance through a deep knowledge of technologies, competitors, and partners.
- Gain a comprehensive overview of innovation landscapes.
- Identify growth areas.
- Monitor the actions taking place in your competitive environment.
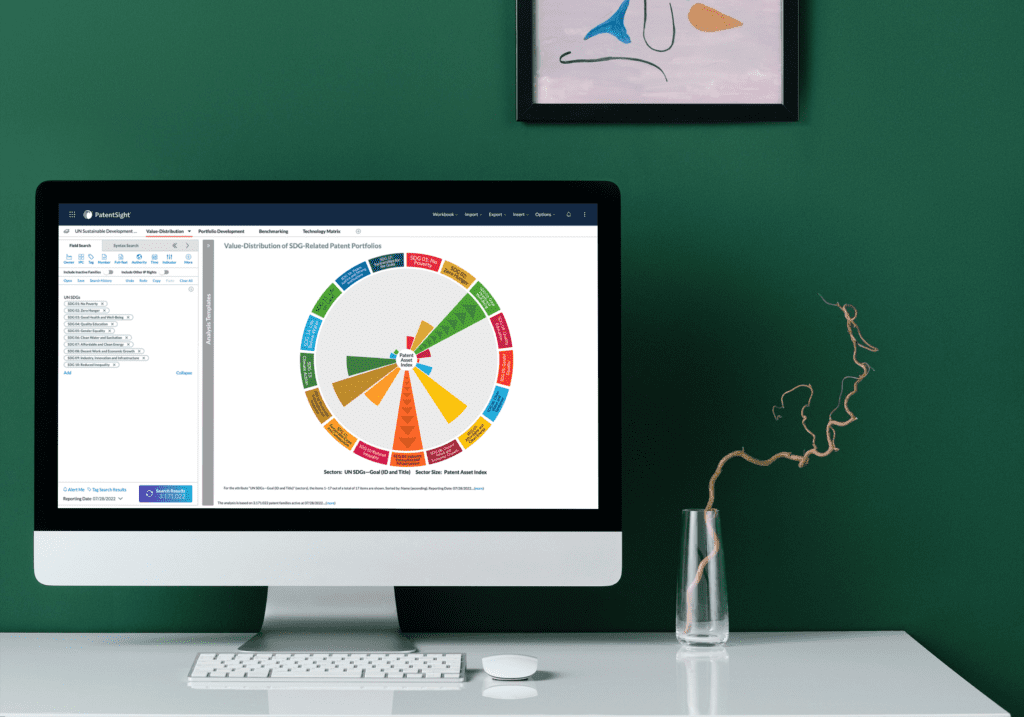
Sustainable innovation analytics
Get actionable insights into how sustainably focused you and your competitors are with a mapping of the global patent system to the UN Sustainable Development Goals (UN SDGs).
- Identify growth opportunities in emerging markets.
- Gain competitive advantages in future-oriented technologies.
- Support strategic decision making for sustainable investments.
- Increase stakeholder engagement and funding.
Risk assessment
Successfully mitigate risks that can harm your IP department and business. Keep track of your competitors in your recent and potential technology fields and avoid:
- Being unaware of an up-and-coming competitor
- Missing out on important technological trends
- Threats from non-practicing entities (NPEs)
- Being unaware of litigious opponents or new market entrants
Licensing & SEPs
Identify promising licensing opportunities that help you turn your patent department from a cost center into a profit center. Bring transparency to SEP licensing and negotiation.
- Find your most valuable patents for licensing.
- Identify potential licensees.
- Pinpoint standard-relevant patents.
- Determine your leverageable position.
- Enable transparent negotiations
M&A Due Diligence
Efficiently assess the value or risk of acquisition candidates then analyze portfolios for technological fit, key patents and answers to critical IP questions.
- Study acquisition targets’ patent portfolios
- Analyze innovation landscapes and technological fit
- Find key patents within portfolios
- Determine critical issues like average ages, remaining lifetimes, legal status, and litigation
Unique benefits that enable strategic decision-making
Data Quality & Coverage
Data Quality
Accurate ownership information
Save time working with pre-corrected applicant data, including information related to recent M&A activity.
Up-to-date legal status
Rapidly distinguish between patent families that are in force, pending or inactive, allowing you to focus your analyses on active patent families only.
Point-in-time data
Watch the IP landscape develop over time.
Data Coverage
Standard Essential Patent declaration data powered by IPlytics
Enhance transparency in SEP negotiations and licensing.
Litigation Data
Understand the litigation profiles of competitors and the strength of their portfolios.
Non-practicing entities
Identify NPEs in your technology field with ease and spot all non-practicing entities’ threats.
Annuity fees
Uncover cost savings in your patent portfolio.
Actionable Insights
Patent Portfolio Quality Metrics
Customized Technology Definitions
Sustainability Assessments
Patent value indicators
Assess patent portfolio quality using the Patent Asset Index — an objective measure of global technological strength and impact.
Cipher Technology Classification
Enhance competitor benchmarking and portfolio optimization by leveraging a personalized view of your specialized technology area.
Unique mapping of patents to the UN SDGs
Conduct objective patent analyses against the United Nations Sustainable Development Goals.
Impactful Visualizations and Communication Tools
Streamlined workflow management and collaboration
Open data
Integrate external data from internal lists or third-party software.
Alerts
Optimize operations through seamless integration of efficient alert systems.
Multi-language environment
Leverage fully adjusted Japanese and Korean language user interfaces and export tools.
Collaboration
Enjoy enterprise-ready collaboration and workflow features.
Export to PowerPoint
Share findings with colleagues and stakeholders by easily exporting static images of the charts and data from your workbooks into PowerPoint presentations.
Compelling IP Storytelling
New findings
Impress colleagues and key decision makers with previously unknown insights.
Big data
Analyze technology fields of any size and get a birds-eye view of the IP landscape.
Patent details
Drill down from technology landscapes to corporate portfolios to individual patents or patent families.
Visualizations
Leverage interactive and customized charts and flexible export options to create boardroom-ready visualizations quickly.
Customer Success Stories
Learn how our customers use advanced data and analytics to improve their IP outcomes.

How PatentSight® Data Analysis Helps Han Santos Become a True Partner and Strategic Advisor to its Clients
Han Santos helps its clients advance their business objectives by protecting, maximizing and leveraging their IP assets.

How a Global Science and Tech Company Assists Their Sustainability Strategy With IP
Discover how Merck KGaA utilizes LexisNexis® PatentSight® to measure and disclose the sustainability impact of its intellectual property by aligning its core business activities with the United Nations’ Sustainable Development Goals.

Increasing Patent Portfolio Strength and Patent Income at Siemens
Learn how Siemens leverages LexisNexis® PatentSight® to increase their patent portfolio strength and patent income.

How a Consulting Firm Uses IP Landscape Analysis to Strengthen Its Clients’ Business Strategies
By leveraging trusted IP data for an IP landscape analysis from LexisNexis® PatentSight®, Perl IP provides clients with an innovation edge.
IP Analytics Reports

“Innovation Momentum 2024: The Global Top 100″ report reveals world’s most dynamic innovators using patent data
Who Is Leading the 5G Patent Race?
Get a unique overview of the 5G patent landscape, including the key players and trends and the implications for various industries.
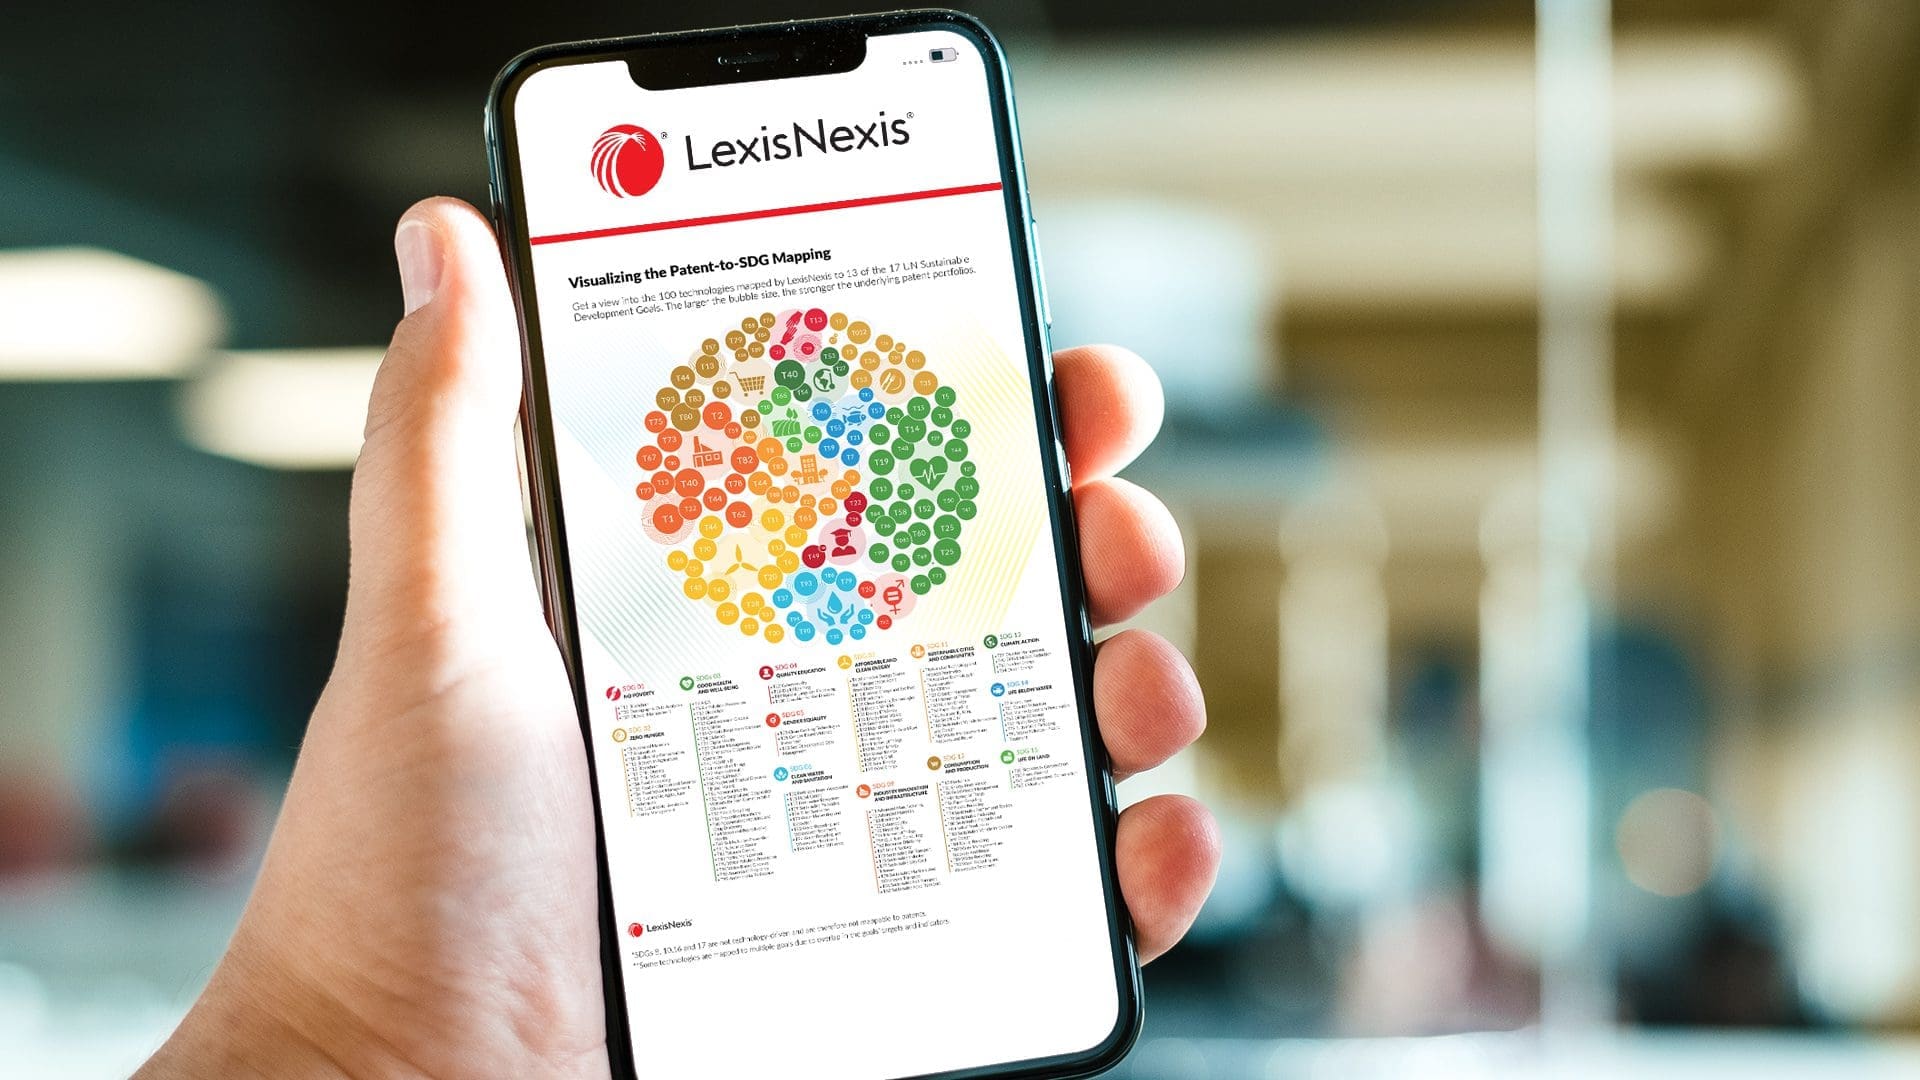
Exploring the Global Sustainable Innovation Landscape: The Top 100 Companies and Beyond
In a first-of-its-kind report, learn which companies are the world’s leading patent owners with the potential to drive transformative innovation toward the United Nations Sustainable Development Goals (SDGs).

Driving Toward Tomorrow: A Deep Dive into Autonomous Vehicle Innovation
Discover the future of transportation with our comprehensive report on the technologies at the forefront of self-driving car development.
Unlock the true value of your portfolio
Learn how to profit from sound patent analysis.
We would love to get to know you and show you some invaluable insights into the IP landscape:
- Let’s have a conversation about your current priorities in IP analytics.
- Get an external view of your portfolio.
- Learn how others see you and survey other market players from a new perspective.
Submit the form, and we’ll be in touch.
Grab the fact sheet
Access and download an informative PDF to share with team members and decision makers.