A Brief Patent Landscape of Chemical Companies

by Dr. Dirk Caspary
Ask a chemist what is so fascinating about their science, most of them will answer, “Because chemistry makes the world go round!” or “It’s everywhere!”. In case you disagree, please try to find an important technology development in the last decades which does not include Chemistry.
In order to get an overview of today’s chemistry patent landscape, the most recently and publicly available chemical companies ranking by the Chemical & Engineering News was combined with the CPC and IPC classes C01 to C14 to obtain a broad chemistry patent database query, which was executed using the LexisNexis® PatentSight® business intelligence platform.
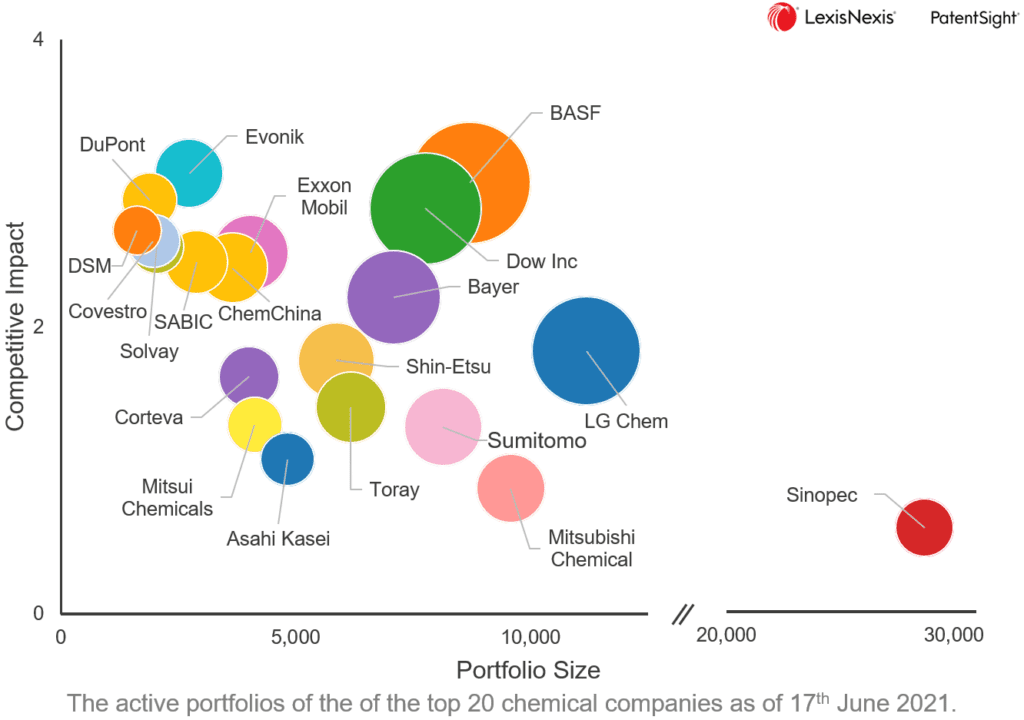
From the patent search results, the 20 chemical companies with the strongest patent portfolios were selected using the Patent Asset Index as the measure for the portfolio strength. The figure shows the average patent quality (Competitive Impact) versus the quantity (portfolio size) for the 20 companies. The bubble sizes are proportional to the respective company’s portfolio strength.
All 20 companies are found on or below an imaginary line connecting the four companies with the strongest patent portfolios: BASF, Dow, LG Chem, and Sinopec. Among these top four patent companies, BASF and Dow beat the general rule of thumb for the portfolio strength, that larger patent portfolios tend to have lower average patent quality. Further, BASF has the strongest patent portfolio, and the second-best average patent quality among the 20 chemical companies despite its portfolio size.
To the left of BASF and Dow, a series of companies with smaller patent portfolios is found which have average patent quality values similar to BASF and Dow. This group includes Evonik, the company with the highest average patent quality (Competitive Impact), which is 0.1 higher than the average Competitive Impact of the BASF patents.
Last but not least and with the largest patent portfolio, Sinopec is found in the bottom right corner of the quality versus quantity plot. The lowest Competitive Impact among the 20 companies is partially compensated by the shear portfolio size, so that Sinopec ranks fourth in terms of portfolio strength. Anyhow theoretically, Sinopec would have to increase its portfolio size by a factor of 1.6 to match the portfolio strength of the far distant BASF.
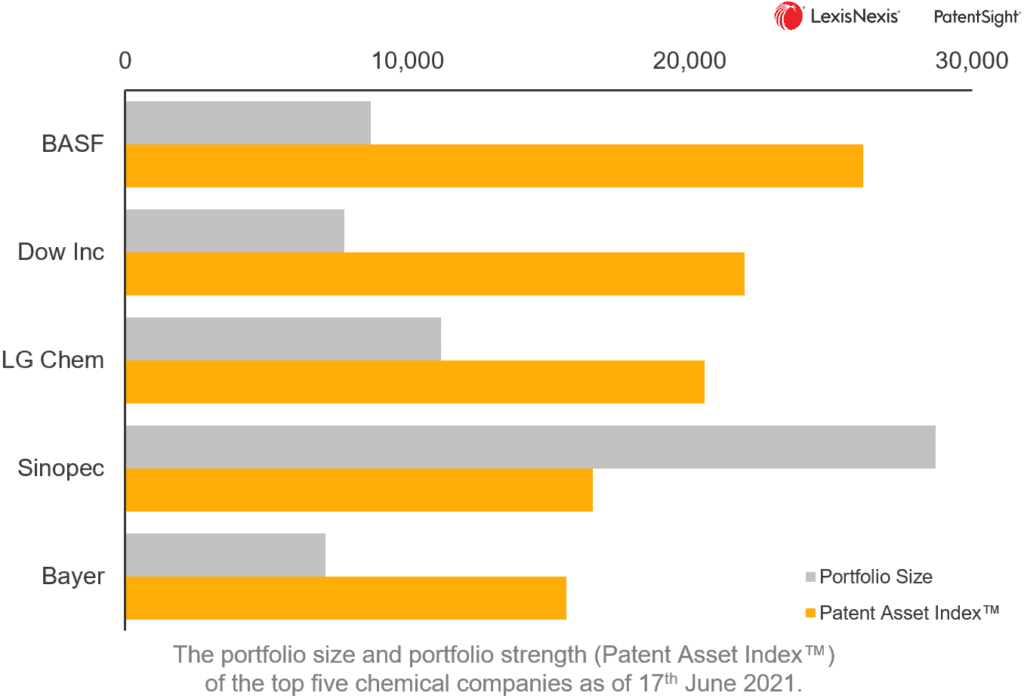
The figure above which shows the direct comparison of the patent portfolio size versus the portfolio strength for the top five chemical companies, thus illustrates more clearly the difference between portfolio size and portfolio strength measured by the Patent Asset Index.
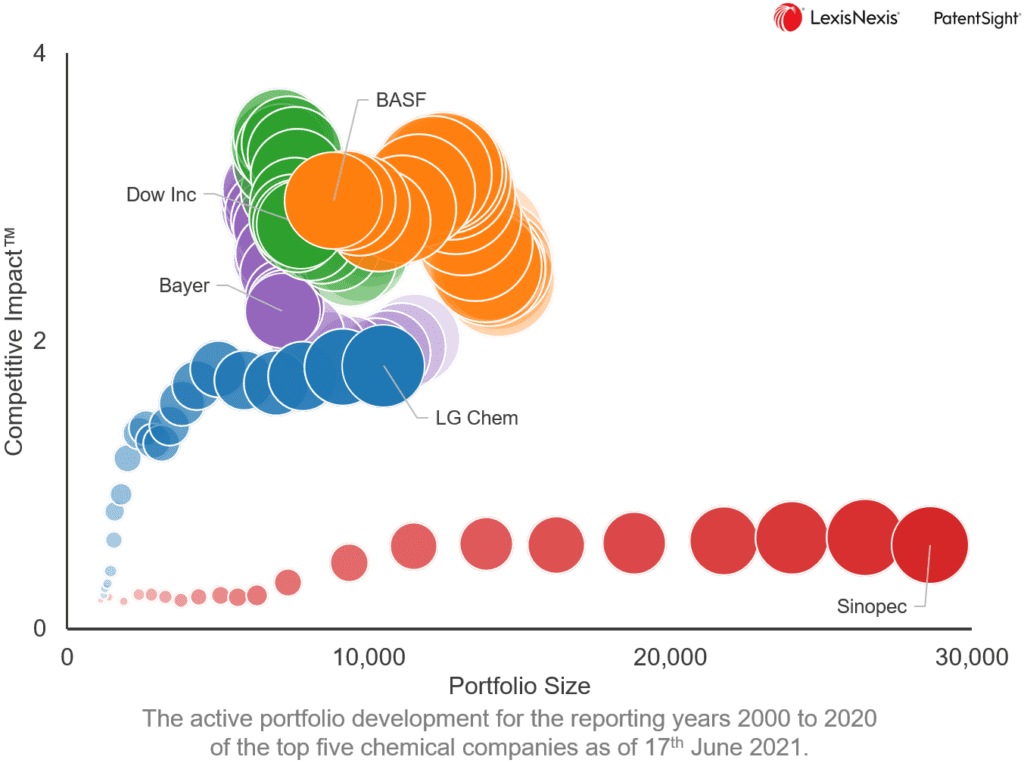
Looking at the development of the Patent Asset Index between 2000 and 2020, it is clearly seen that BASF has been the owner of the strongest patent portfolio ever since. With respect to the slightly decreased portfolio size in recent years, this means that the average patent quality (Competitive Impact) of the BASF patent portfolio has further increased during the same period.
In contrast, LG Chem and Sinopec show a distinctly different development: both patent owners increased their respective portfolio sizes, but whereas LG Chemical significantly increased its average patent quality until 2015, Sinopec hardly improved its average patent quality.
It will require a much more detailed analysis of the chemical companies and their technologies to gain full insight into today’s chemical technologies. Considering e.g. BASF and LG Chemical, they are quite different companies. In case of BASF, the respective strongest five CPC main groups including its sub-groups are:
- A01N 43/00 “Biocides, pest repellants or attractants, or plant growth regulators containing heterocyclic compounds”;
- B01J 37/00 “Processes, in general, for preparing catalysts; Processes, in general, for activation of catalysts”;
- C08G 18/00 “Polymeric products of isocyanates or isothiocyanates”;
- C08K 5/00 “Use of organic ingredients” as compounding ingredients; and
- C12N 15/00 “Mutation or genetic engineering; DNA or RNA concerning genetic engineering, vectors, (…)”
Accordingly, the strongest five CPC main groups for LG Chemical are:
- C09K 11/00 “Luminescent, e.g. electroluminescent, chemiluminescent materials”;
- H01L 51/00 “Solid state devices using organic materials as the active part, (…)”;
- H01M 4/00 “Electrodes” in processes or means for the direct conversion of chemical energy into electrical energy like batteries;
- H01M 10/00 “Secondary cells”; and
- Y02E 60/00 “Enabling technologies or technologies with a potential or indirect contribution to GHG [Green House Gas] emissions mitigation”.
But eventually, these differences also show that chemistry is everywhere!
How are we able to show you such reliable innovation insights? It’s all in the data!
Read A Handbook for Patent Data Quality to find out more about the LexisNexis approach to enhancing patent data.
Learn more about PatentSight and the Patent Asset Index.